

- The US may have already seen peak recovery, while Europe should reach it in Q3.
- In the meantime, China continues to tighten policy, but maybe not for much longer.
- In our view, the global economy will begin to slow sometime this summer, whether measured by GDP, PMIs or corporate earnings.
- This will likely calm inflation fears and help Growth vs Value.
- Gold has pared all its losses in 2021 as inflation expectations have risen and real yields have come down. After consolidating its gains, we expect new highs this year.
- Our big picture remains attractive for equity markets.

Peak recovery equals peak inflation fear?
- Choppy markets and inflation angst made equity investors pare their bullish positions over the last month.
- The dollar is at a crossroads. If it drops further, it will set a new seven-year low and strengthen the belief that it is now in a secular downtrend. In the short term, however, we are expecting a technical rebound from oversold levels.
- In the credit market, High Grade and High Yield spreads have tightened to below-average levels faster than has ever occurred after a recession.

Market Development
World
- Market Sentiment has notably retraced, while major indices have remained near their all-time highs.
- We are observing more and more signs that the strongest recovery period may already be behind us. Most recently, the employment component of the US ISM Manufacturing indicator for May came in at just 50.9, its lowest value since November (before the second US stimulus package).
- The market has yet to understand the Fed’s new reaction function according to which it will react to outcomes rather than forecasts.
- In this context, the Fed is strongly focused on employment, suggesting that we are back in the “upside-down-world”, in which a weaker US employment recovery may be good for risk assets, as this would imply that tapering will be pushed backwards.
Europe
Economic confidence, as measured by the EU Commission, took another big leap upwards in May, reaching 114.5 points, the highest level since the beginning of 2018. The sentiment improved for the third month in a row in all economic sectors. The services sector (+5.0) saw the strongest increase and is now back above its long-term average for the first time since February 2020.
Switzerland
The KOF Economic Barometer recorded its fourth consecutive increase in May, once again reaching an all-time high and now standing at 143.2 points. The strong increase in May is primarily attributable to various indicators for the manufacturing sector and to rising foreign demand.

Setup for risk assets remains attractive
Recent business surveys continue to highlight the role of supply bottlenecks and labor shortages in boosting prices. Simultaneously, business confidence in almost all major economies is close to record levels, with the improvement extending to service sectors in anticipation of the further removal of restrictions on interaction and mobility. In our opinion, economic growth expectations, as well as inflation fears, are likely at or close to their peak.
Our view is that macro indicators will cool off in the third quarter, while inflation readings are expected to peak in May, with May CPI numbers to be released in June. That is not to say that inflation will disappear, but it will likely retrace from the highs and then stabilize at higher than pre-Covid levels, as supply ramps up and the initial pent-up demand on reopening wanes.
This outlook implies that fears about an overheating economy and Fed-tapering could be cooling off too. The overall backdrop could then transform into a “Goldilocks” environment. The market narrative is not there yet and while it forms, we expect tailwinds for equity markets.
Historically, central banks tend to turn more dovish on the margin when year-over-year inflation peaks. This time, it is unlikely they will become more dovish overall, but it could translate into pushing back serious taper discussions into Q4 of this year.
In such an environment, we think that investors would start to rotate out of cyclical trades and climb up the quality ladder in their equity portfolios. We think that US and Asia Big Tech could regain leadership over the summer.
The biggest risk to this outlook is another spike in bond yields.
One caveat to consider is the currently positive correlation between stocks and bonds. The quality/growth trade would need this correlation to revert back into negative territory. At the moment, the correlation between U.S. stocks and Treasuries is at its highest level since 1999. The correlation has tended to be positive during periods when inflation was a significant concern for markets. That said, compared to March of this year, the bond market appears to be on much healthier ground now, as highlighted by last week’s smooth Treasury auctions.
Positioning
Our big picture remains supportive of equities. The central bank liquidity tailwind, fiscal stimulus, excess savings/pent-up demand, reopening momentum, strong corporate earnings, positive earnings estimate revisions, operating leverage, buybacks, and still low global bond yields will continue to support risk assets into the summer.
Despite this attractive backdrop, major equity markets have been moving sideways near the top for nearly two months – in the case of the Nasdaq even since the beginning of the year.
The potential realization that the Fed is willing to accept higher inflation and does not feel pressured to act aggressively on tightening, coupled with the notable wall of worry in investors’ sentiment could be the drivers to push equity indices to new all-time highs.
In our view, Fed-sensitive assets (Bonds, Gold, non-USD currencies, Growth stocks) rather than cyclically sensitive ones could see a period of outperformance in this environment. Following this thinking, we recently added to our position in the world’s largest gold miner, Newmont Corporation.
Once the market narrative changes to an overall “goldilocks” state, this will be our signal to become more cautious.

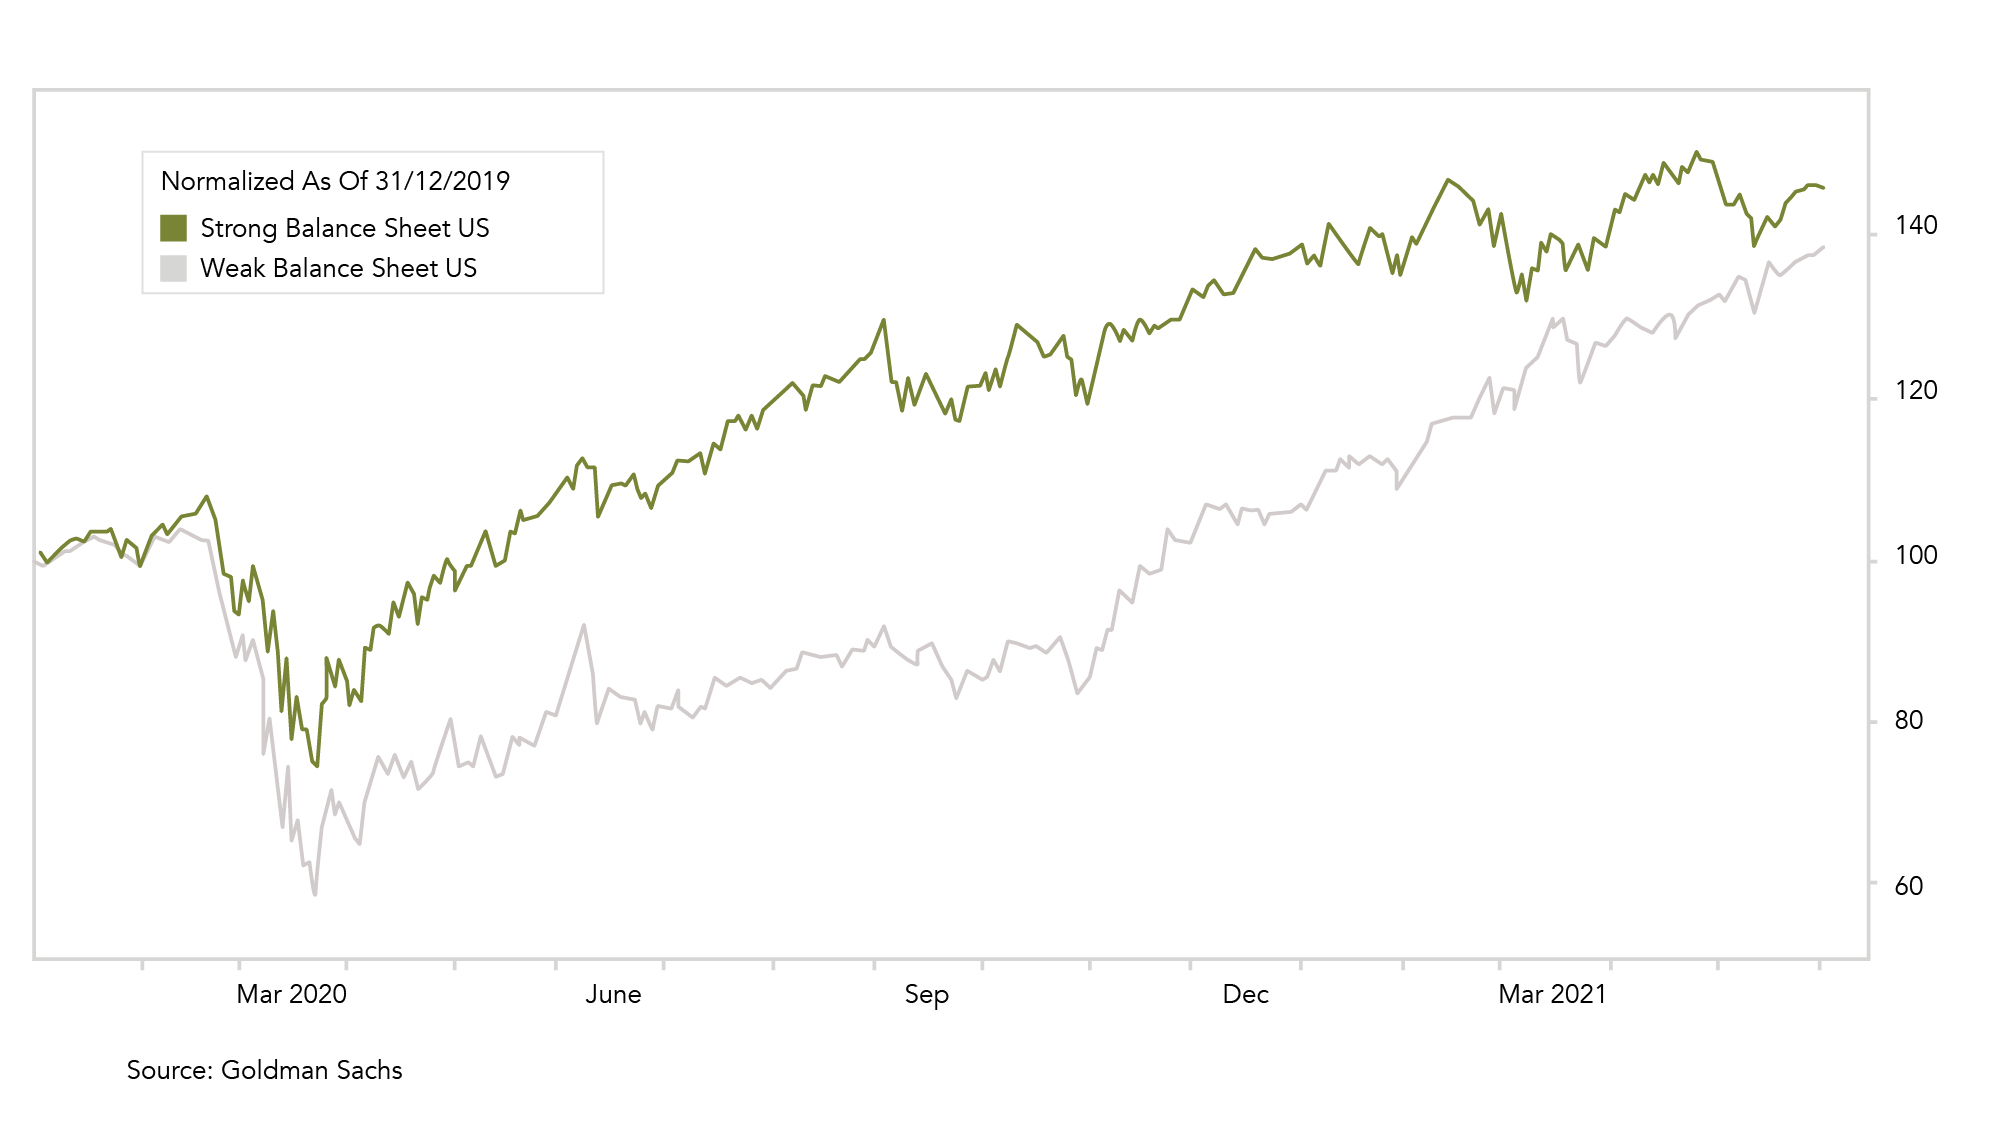
Chart
The indices use the Altman Z-score to measure balance sheet strength. The Z-score is a weighted sum of five financial ratios and was originally developed to forecast bankruptcies. Companies with weak balance sheets (concentrated in cyclical sectors) have been outperforming companies with stronger balance sheets (e.g. big tech and quality stocks) in recent months.
Sources: Bloomberg, Goldman Sachs, Saxo Bank, The Market Ear, JP Morgan, Bank of America, Citi, Zürcher Kantonalbank, Scotiabank, Morgan Stanley, Kepler Cheuvreux, UBS, McClellan Financial Publications
FINAD CIO Team
