
We observe a growing divergence between financial markets and the real economy. It is important to understand that this divergence can get more pronounced and valuation multiples can expand further, despite the dramatic fallout we are seeing in the real economy. Markets are currently driven by a wave of easy money and the “fear of missing out” of investors who de-risked when volatility was at its highest in late March and who now feel the pressure to chase the rally.
That said, our perception remains that the risk-return trade-off for broad equity markets has become considerably less attractive in recent weeks. The coming months will likely see the market situation and market sentiment change back and forth because of political decisions, corporate news, epidemiological findings and pharmaceutical research.
We believe that a diversified portfolio with an emphasis on quality stocks and physical gold should do well in such an environment. Patience, caution and selectivity remain key.
Recent Developments
- US Q1 GDP came in at -4.8% annualized, the biggest slide since 2008 and the first contraction since 2014.
- Gilead Sciences announced that its experimental drug “Remdesivir” helped patients to recover faster than under standard care, offering hope for what could be the first effective treatment against COVID-19.
- The announced cut of 9.7mn barrels a day from OPEC+ earlier this month has so far failed to stabilize the oil market, since the oversupply still ranges from 15 to 20m barrels a day. Analysts estimate that approximately 25% of the US oil industry will be forced to shut production in the next weeks.
- Central banks around the world are going “all in” with unlimited support for markets. Yesterday, the Fed pledged to continue to support financial markets and to keep rates near zero until full employment and inflation come back. The Fed has expanded its balance sheet by more than USD 2.4 trillion since the end of February (a roughly 60% increase in size).
- Likewise, the Bank of Japan initiated unlimited bond-buying. The previous guideline on buying government bonds was to increase holdings by USD 743bn per year – already a huge amount but seemingly not enough.
- The 5 largest stocks in the S&P 500 (MSFT, AAPL, AMZN, GOOGL & FB) are all reporting earnings this week. Google parent Alphabet was first to move. It reported a strong first two months of 2020 before a «significant slowdown in ad revenues» hit in March.
- These 5 big growth names are now representing more than 20% of the index, implying a highly concentrated market. This corresponds with an overall market development of intensifying outperformance of growth stocks versus value stocks.
Assessment
- While economic data are likely to remain weak in the near term, the current market believe is that the combined suppression of the risk-free rate and credit spreads by the Fed has a bigger positive impact on equity valuations, compared to the negative impact of the perceived temporary earnings loss and economic shock.
- Retail money has been a strong contributor to the recent rally, while institutional money remained on the sidelines.
- Mutual funds’ cash holdings were at record highs at the beginning of April and neither systematic investors nor hedge funds are reported to have bought the dip aggressively – but keep in mind that this data is only reported with a lag
- The shock and awe approach of central banks is probably over for now. Any massive additional support measures would demand another period of severe market stress. The question remains how long market sentiment can run on the already announced measures.
- Looking further out, the long-term impact of COVID-19 could spark the return of inflation. De-globalizationary forces will increase as politicians in the Western world will be looking to repatriate production chains and the fragile US-China trade truce could come under pressure once the imminent crisis is over.
- On top of that, negative real yields (financial repression) for many years to come seem like the only way out of the massive global corporate and sovereign debt burden.
FINAD Positioning
We have been deploying cash by adding and buying into stocks with healthy balance sheets and strong business models. We feel confident about this strategy.
- On a portfolio level, we prioritize diversification, liquidity and high quality in our risk assets and stay away from strategies with return expectations inherently based on leverage.
- That said, we are selectively looking at portions of credit that were hit very hard and now offer attractive risk-adjusted returns.
- As yields are extremely low globally, long duration sovereign bonds should not be expected to provide the desired hedging mechanism going forward. Thus, we have taken profits and completely sold our high grade sovereign bond exposure.
- We view gold as the primary portfolio diversifier, based on the huge increase in money supply and expected surge in sovereign deficits. We believe global negative real yields are here to stay and will present a strong tailwind for the precious metal.
Your FINAD CIO Team
Source: Bloomberg, The Market Ear, JP Morgan, Hightower Advisors, Morgan Stanley, The Morning Brew, Kepler Cheuvreux, Bank of America, Goldman Sachs, Sanford Bernstein, Barclays
Appendix
Factor rotation overdue?
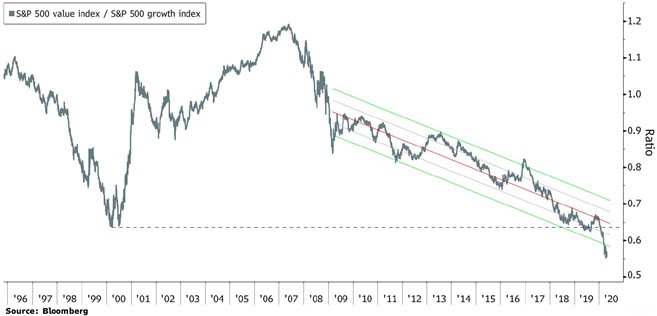
The underperformance of the S&P 500 Value Index versus the S&P 500 Growth Index is now even more pronounce than at the peak of the internet bubble.
To some extent this can be explained by looking at the sector weights associated with the value and growth factor – most notably the massive overweight in Information Technology in the Growth Index.
We should keep in mind that extreme factor performance has been followed by a period of mean reversion in the past.
Sector Weights:
S&P 500 Value Index
| Health Care | 21% |
| Financials | 18% |
| Consumer Staples | 12% |
| Industrials | 9% |
| Info. Tech. | 8% |
S&P 500 Growth Index
| Info. Tech. | 38% |
| Consumer Discretionary | 15% |
| Communication Serv. | 13% |
| Health Care | 11% |
| Industrials | 7% |
The “Quality Factors” Growth, Profitability and Size have significantly outperformed year to date. Companies with exposure to these factors are said to offer less cyclicality, more robust balance sheets and benefit disproportionately from central bank actions due to their relative weight in indices and passive investment products. Obviously, much of this trade has manifested itself in the big Tech companies named previously.
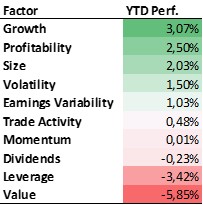 | Factor returns are derived by calculating the performance differential of a group of stocks with strong/high factor characteristics versus a group of stocks with low factor characteristics (e.g. simplified for the “Size” factor: how larger market cap stocks performed versus smaller market cap stocks). |
Source: Bloomberg PORT U.S. Equity Fundamental Factor Model as of 29.04.2020
| Factor | Factor Description |
| Growth | Growth aims to capture the delta between high and low growers by using historical fundamental and analyst forward-looking earnings and sales data. |
| Profitability | Profitability studies firms’ profit margins to differentiate between money makers and money losers. |
| Size | Size is a composite metric distinguishing between large and small stocks (Submetrics: Market Cap, Sales, Total Assets) |
| Volatility | Volatility differentiates more and less volatile stocks in terms of price returns. |
| Earnings Variability | Higher earnings variability implies higher volatility in earnings, cash flows, and sales over recent years. |
| Trade Activity | Trading activity is a turnover based measure, where turnover is defined as trading volume normalized by shares outstanding. |
| Momentum | Momentum separates stocks that have outperformed over the past year and those that have underperformed. |
| Dividends | Dividend yield is another dimension of value, but distinct enough to be a standalone factor. |
| Leverage | Leverage is a composite metric to gauge a firm’s level of leverage (Submetrics: Book Leverage, Market Leverage, Debt to Total Assets). |
| Value | Value is a composite metric that differentiates “richly” valued and “cheap” stocks. (Submetrics: P/B, P/E, P/CF, EV/S, Forward P/E). |
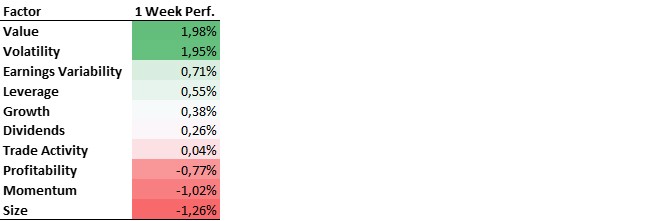
As the “Quality Factors” become more and more crowded, the pain trade (a market move for which the least number of market participants are positioned and thus would inflict the most “pain”) for many active investors could come from a ‘risk-on’ style rotation into cyclical value stocks. One might also say from a rotation from “stay at home” to “re-opening” stocks.
In fact, in the last week we saw outperformance of value and higher leveraged companies and an underperformance of quality stocks. This may be interpreted as a sign of increasing investor risk appetite as the rally has taken on more steam.
We will watch carefully whether it is the beginning of a bigger rotation or just a short-term event which will peter out once month’s end rebalancing flows have run their course.