
- The Fed liquidity backstop to help US banks suffering from deposit outflows has calmed the banking turmoil and ignited hopes for a Fed pivot.
- Markets are behaving as if QE has just been announced, as highlighted by movement into known “liquidity plays”: tech mega-caps and assets without perceived bank counterparty risks (i.e. gold, USTs, BTC). The rally is focused on FANGs while banks remain near the lows, indicating fragility beneath the surface.
- Fears of an imminent systemic crisis did not materialize, however in our view the probabilities of a hard landing in the second half of the year have risen, as recent banking turbulence will tighten credit conditions going forward – adding to the already slowing growth environment.
- The Fed’s trilemma of conflicting goals for fighting inflation, re-balancing the labor market and ensuring financial stability has grown further.
- Commercial real estate could be the trigger that turns this from a liquidity to a balance sheet crisis sometime this year.
Bond markets are very concerned while equities remain calm
- We note a clear divergence between the bond market and risk assets, with bonds signaling sharply rising probabilities of a recession this year (e.g. via re-steepening of the yield curve) while broad equity markets and HY credit are not pricing in any form of hard landing.
- With Credit Suisse’s forced acquisition, one of the 30 global systemic banks is now gone. Although we can’t rule out further banking stress, we find the consequences of the events that have already taken place in respect to the credit cycle to be bigger worries.
Market Development
World
- Banks tend to tighten lending standards after having to borrow at the discount window and we suspect this time will be no different. The cascading effect is a slowing economy, more difficult business conditions, and rising unemployment moving forward.
- As of March 15 we have tracked a US deposit-loss of ~USD 600bn since the Fed began raising rates – the largest ever in US banking history.
- Deposits at commercial banks are now down 3.33% YoY, which is the biggest drop on record and double the prior record from 1994 (data since 1974)
Europe
- Europe’s real estate equities are trading at global financial crisis-level valuations, with the Stoxx 600 Real Estate Index down by 37% in the past 12 months (Total Return in EUR).
- High debt and dependence on mortgages make the sector vulnerable to rising interest rates. Debt as a percentage of enterprise value has soared to 60%, the highest since 2009, and refinancing debt could become more costly with Euro area rates now at 3.5%, compared to less than 0.5% for most of the past decade.
Switzerland
- According to the KOF economic barometer, the economic outlook in Switzerland did not brighten any further in March for the first time in four months. However, the economic outlook remains significantly better than it was a few months ago.
- The SNB raised the key rate by a further 50 basis points to 1.50%. The key interest rate is now at its highest level for almost 15 years.
Will commercial real estate go down the deposit drain?)
Recent stress in the banking sector has fueled concerns about spillover effects into the commercial real estate (CRE) industry. The fear is that CRE could trigger a credit crisis later this year, due to a confluence of post-pandemic headwinds, including work-from-home, declining occupancy rates, falling appraisal values, and rising defaults. In any case, the sector will face a challenging fundamental backdrop in the coming months, coupled with higher funding costs, elevated funding needs, and tighter lending standards.
- US CRE is a ~USD 21tn market according to Nareit Research.
- US CRE mortgage financing differs from residential real estate in respect to its non-amortizing mortgages (i.e. with bullet payments at the end) that require refinancing every 5 to 10 years. This year, USD 450 billion of CRE debt is set to mature and needs to be refinanced, with an additional USD 550 bn per year until 2027, totaling USD 2.5 trillion.
- CRE has already seen USD 3bn of defaults in March alone (Brookfield on a USD 748mn loan for LA offices; PIMCO on a portfolio of USD 1.7bn asset backed mortgage notes; Blackstone on USD 562mn in Nordic CMBS).
- Retail banks have a substantial exposure to CRE lending, with 70% of CRE debt originating from regional banks (defined as any US bank with up to USD 250bn in assets)
- The latest data from Real Capital Analytics shows that vacant office space in the US is at its highest level ever at 18.7%. Office occupancy rates are at about 50% in major cities and no rent is being paid on one-fifth of all US office space. All this means that a majority of US office buildings is likely worth much less than when these loans were issued.
We still think the Fed will only reactively pivot from its inflation fight campaign – not proactively – as arguably not enough economic pain has occurred just yet. We expect tighter credit conditions to start biting in the second half of the year.
The next market catalyst should be the upcoming Q1 earnings season. We expect weak management guidance to trigger the next wave of analyst down-revisions and see the earnings recession as ongoing.
Positioning
We view the last two weeks’ price action in risk markets as complacent and driven by hopes of QE-like liquidity injections.
- The Fed’s newly introduced Bank Term Funding Program (BTFP) is merely intended to backstop the self-reinforcing doom loop of forced selling triggered by depositor outflows. Most analysts think that this is not QE, and we agree. There are several reasons, the two most important ones being that these are collateralized loans (not “grants” like QE) and duration is only removed temporarily from markets up to one year (not indefinitely like QE).
- So far this has not stopped the equity market from pricing in slowing growth and QE environment where the big winners are the quality factor (think about FANGs with “fortress” balance sheets without the need to tap funding) and assets that benefit from lower real yields. In this context, gold just closed its highest quarter-end ever.
We consider our portfolio well positioned for the current environment: no bank exposure, high quality equities with a long put overlay, a sizable gold position, and still a lot of AAA short-term government bills which we will use to buy equities and/or credit when the market has finally priced in the eventual hard landing.
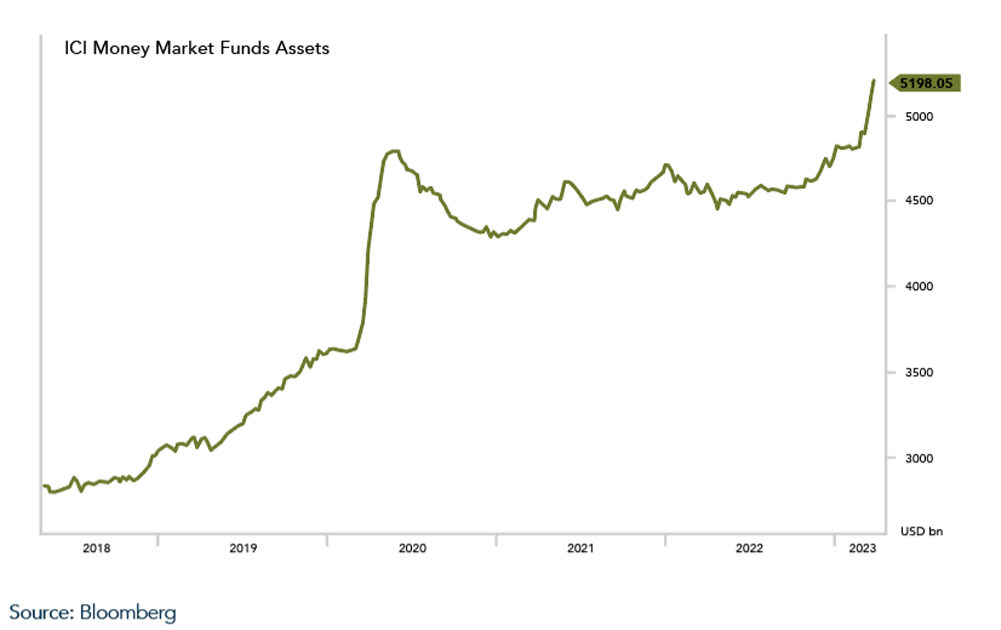
Chart
According to data from BofA, global money market funds experienced inflows exceeding USD 60 billion in the week ending March 29th. The total amount of U.S. money market funds has increased by a significant USD 305 billion since the beginning of March, reaching a total of USD 5.2 trillion.