
FINAD Market View
Juli 2023
- The first half of 2023 has defied consensus expectations, shifting from credit crunch and recession fears to a soft-landing consensus and AI euphoria. However, avoiding a US hard landing would be historically unprecedented given the macro-context.
- Markets are currently disregarding upside risks in inflation and rates on one side and downside risks in growth, the credit cycle and earnings estimates on the other side.
- The Conference Board Leading index has fallen to levels that, since the 1960s, have always been followed by a real US recession.
- The question is whether or not “it is different this time” and AI will lead to far higher productivity, earnings and economic growth as quickly as is being priced into markets and analyst consensus. We believe this to be a gradual process that will take place over several years, similar to other technology adoption patterns – and which is therefore prone to short-term disappointment.
- Given the strong upside momentum, equity positioning of systematic strategies has increased dramatically, indicating a lack of safety net and broad FOMO (fear of missing out) mentality.
- The S&P 500 forward P/E ratio at 19-20x is stretched, particularly when compared to real yields.
US stocks soar in the first half on AI hype and hope for a Fed pause, but inflation and recession risks loom
- US stocks rallied in 2023, with the Nasdaq 100 recording its best first-half gains due to AI buzz and easier Fed policy expectations.
- However, sticky inflation, disappointingly hawkish central banks and re-emerging concerns about a recession and declining corporate earnings are risks for the second half (especially towards year-end).
- The first half saw the narrowest S&P 500 breadth in history, with only 25% of stocks outperforming the index.
- The Russell 1000 Growth index outperformed the Value index by 24 ppt, reversing last year’s underperformance, and is now trading at a very stretched 98% historical percentile of outperformance.
- Since the debt ceiling deal, over $850 billion in new US debt has been added in just a month.
Market Development
World
- Virtually all performance since the October lows comes from multiple expansion. The S&P 500 is now trading at a 20x forward P/E with 10-year real yields back at 1.60%, near the highs of the past 18 months. For reference, when real yields hit 1.75% last October, the forward P/Es had dropped to 15-16x.
- Despite remarkably resilient real-time data, forward-looking data continues to suggest a potential US hard landing. The US ISM manufacturing Index fell to a 3-year low in June, with all subcomponents now in contraction. Consumer excess savings are dwindling, profit margins are peaking, and money supply is contracting in the US and Europe.
- Markets are pricing a “higher-for-longer” rates regime. The US Yield Curve (2y/10y) inversion is now at the most extreme level we have seen since the 1980s.
Europe
In June, inflation in the eurozone declined again to 5.5% YoY. Food and goods prices appear to have passed their peak. By contrast, services inflation – also due to special effects in Germany – remains elevated. This picture will probably not change over the summer months. Further ECB interest rate steps remain likely.
Switzerland
In June, the KOF Economic Barometer dropped to 90.8 points, a 0.6 point decrease from May. However, May’s steep decline was less drastic in hindsight, with the previous month’s figure being revised upward from 90.2 to 91.4. June marks the third consecutive decline for the gauge, which has now remained below its medium-term average for over a year.
US recession only delayed – not denied, as the Fed is likely not done hiking.
The US economy has demonstrated remarkable resilience in the face of a series of adverse shocks this year. The banking-sector turmoil following the collapse of Silicon Valley Bank in March hasn’t tightened credit as much as feared so far, and the debt-ceiling standoff was resolved without lasting spillovers to financial markets.
Many were positioned for a recession to hit at the start of this year, but as the year progressed without the anticipated downturn, the narrative has shifted. A recession is now deemed “canceled” and a “higher for longer” narrative is prevailing. We were at a similar point in early March – just before the banking turmoil.
Why is soft data (surveys) and hard data diverging so much?
Steno Research sums it up perfectly: Expectations and surveys reflect the “real” outlook, while the reality remains “nominal,” which has been a persistent issue over the past 18 months due to elevated inflation figures. When nominal demand remains elevated, the engine of the economy does not stall in the same manner as when nominal demand is subdued. And so far, only certain sectors are feeling the pain in “real” terms.
Why is the hard landing postponed compared to consensus expectations?
During the period of zero interest rates, long-term debt was refinanced and massive direct-to-consumer-stimulus was handed out, which led to a delayed response to higher interest rates. Additionally, the labor market remains atypically tight due to reduced labor supply vs demand (labor-hoarding, a construction boom and aging demographics). However, it is crucial to recognize that this delay does not necessarily equate to cancellation.
Despite the current resilience, we maintain our view that a hard landing is still on the horizon (starting end of this year, we think), and that there remains a risk of monetary overtightening leading to a sharper economic slowdown. The issue lies in the possibility of inflation being stickier than anticipated by the consensus and desired by central banks. This could compel central banks to return to their hawkish approach of 2022 at a time when the downturn in the cycle has progressed even further, closer to a potential recession.
- The path from 9% to 4% inflation was relatively straightforward, driven largely by the reversal of supply chain induced inflation, known as the “transitory” portion. Many now linearly extrapolate this disinflationary trend. However, CPI data may turn surprisingly sticky as early as July (data to be released in August) as favorable basis affects roll out.
- Unfortunately, research from 42macro, which has back-tested all business cycles since World War II, shows that breaking structural inflation has always required a real recession in the past.
Positioning
In our view, to chase the rally and add risk here, one implicitly needs to have the expectation of a fully-fledged bubble forming (equity risk premiums are close to the lowest levels seen in 20 years). In the short-term, “animal spirits” can overpower all mid-term risks, but don’t mistake an impressive, yet fragile, Goldilocks rally for sustainable fundamental improvements.
- Our base case remains that a US hard landing is still ahead, most likely starting in Q4 with Q1 2024 as the second most likely start.
- This view has prevented us from becoming too negative at the end of last year and led us to increase our equity quota from underweight to neutral in Q4 2022, when analyst consensus was extremely negative and positioned for an imminent hard landing. Now, it also likely prevents us from becoming too optimistic on risk assets for the next 2-3 quarters. (We will keep an open mind as always, however.)
- Until the Fed reintroduces fears about tightening, or we get a real recession signal from the labor or credit market, stocks may continue to ignore the mid-term risks.
- In any case, there are clear tactical signals (above all sentiment) that the current rally has run too far too fast and needs to correct.
- Tech underperformance from here is a clear pain trade given the massive inflows. Tech stocks have the highest relative sentiment in 23 years, according to Macro Charts. We took some profits and rebalanced to less crowded market segments.
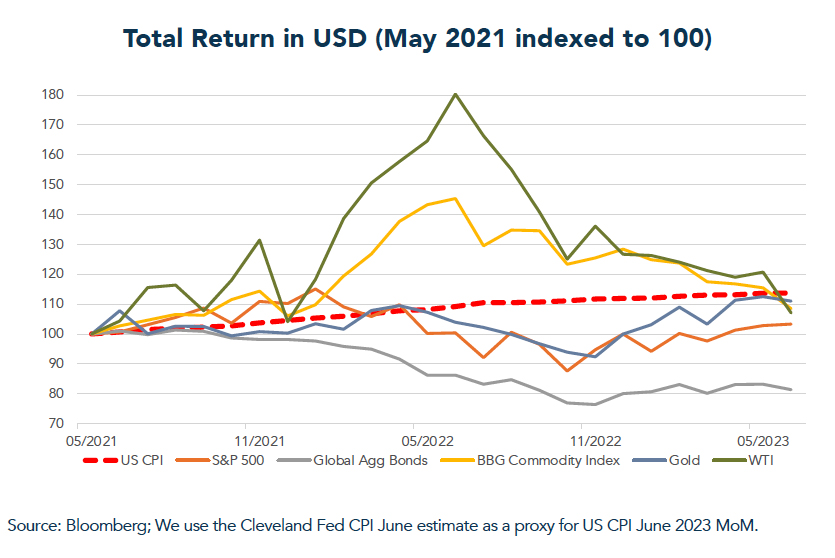
Chart
Over the past two years, major asset classes have failed to deliver positive inflation-adjusted returns. It is worth noting that real assets have performed considerably better than nominal assets such as bonds. Gold has come closest to preserving purchasing power.