

Pitfalls in the Interpretation of Performance Indicators (Part 1 of 2)
When looking at the current positive trend in the private equity (PE) universe, it becomes evident that investments have increased significantly over the last ten years, when considering the number of newly launched funds. For example, compared to the 107 PE funds launched in 2010, this number has already risen to 154 PE funds in 2019. This increasing supply of funds complicates the selection process for the investor. Particularly the analysis of the performance is connected with difficulties, since the indicated performance data does not always correspond to reality or lacks validity. For this reason, it is essential for a potential PE investor to understand the most basic performance indicators for PE funds.
In the following series of articles, we explain the most important metrics for interpreting the performance of private equity (PE) funds by using an example and point out their biggest pitfalls.
The two most important measures that have to be taken into account for the valuation of PE funds are the internal rate of return (IRR) and the so-called “cash-on-cash” multiples. The following article focuses on the “Cash-on-Cash” multiples, which are easy to calculate and interpret compared to the IRR. In simple terms, the return of a PE fund is calculated based on the underlying cash flows. Accordingly, cash flow data and their accuracy are of utmost importance. For example, if this data is not available for each PE fund in a PE portfolio, the portfolio performance cannot be derived by averaging the IRRs of the underlying funds. [1]
“Cash-on-Cash” multiples are cost basis multiples that express the value of an investment’s return, however they do not take into account the timing of those cash flows. One example is the “Distribution to Paid-In” (DPI) ratio, which puts the distributions of a fund in relation to the capital invested. Accordingly, a DPI >1 leads to the conclusion that more than the originally invested capital has already been paid back through distributions. Similarly, the so-called “Residual Value to Paid-In” (RVPI) ratio can be calculated. Here, instead of the fund’s distributions, the underlying residual value within the fund is used as the numerator for the calculation. The residual value is the unrealized estimated value of the underlying assets that would result from a sale at the respective time. As the residual value is estimated by the manager himself, this ratio is easier to manipulate than the DPI and should therefore be viewed with caution. [2] Both of the above-mentioned ratios can be consolidated in the so-called “Total Value to Paid-In” (TVPI) ratio. This ratio is calculated by adding the DPI and the RVPI, therefore the TVPI represents the ratio between the distributions already received and the residual value. This ratio is particularly suitable for obtaining an overview of the current investment status of a PE fund. Even if this ratio offers the best overview compared to the DPI and RVPI, this ratio should also be treated with caution, as the residual value is once again included in the calculation and therefore depends on the estimate of the manager.
With the introduction of the performance indicators above, it becomes evident that the performance measurement of PE funds is a complex procedure. One reason for this complexity is that in most cases the shares of private equity funds are not traded on the public market. The same is true for a fund’s underlying assets, whose available market price information is often outdated and may be subjectively estimated by the manager. Years may have passed between the last public reporting of a company acquisition or financing round and the current total value of a fund’s assets (NAV: Net Asser Value). The circumstances previously listed provide managers with the necessary framework to report their achieved results in an embellished manner. To illustrate the implications of these key figures, we have created three fictitious funds with their underlying cash flow data, as well as the consolidated portfolio from these three funds in Table 1. To enable comparability of the funds, the fictitious funds shown differ only in their residual value and the corresponding timing of cash flows (capital calls and distributions).
Table 1: Example calculation of different performance indicators for three fictitious PE funds and a PE portfolio
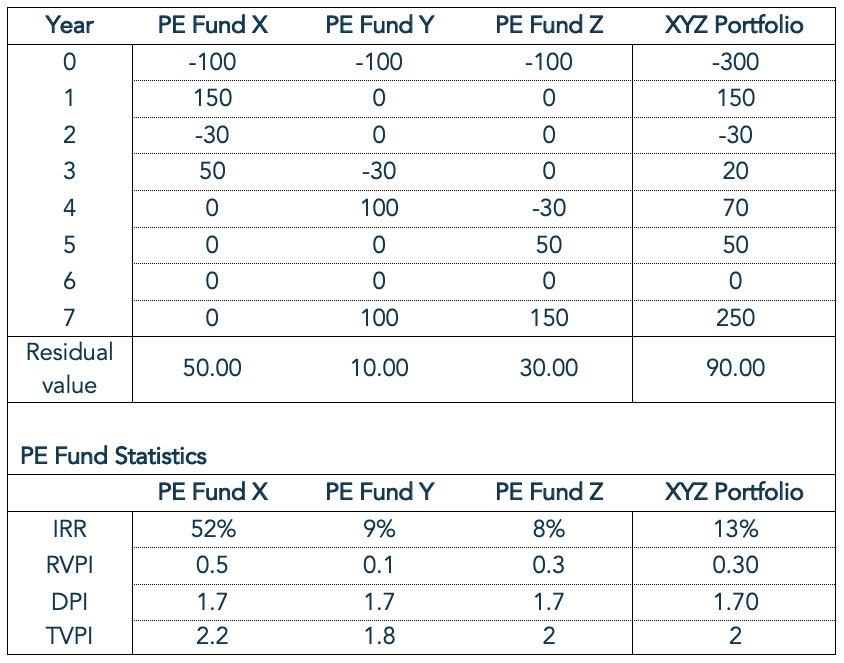
The PE funds in Table 1 therefore have the same number of capital calls and distributions, which means that the DPI is identical for all funds. In contrast, the TVPI also shows different results for the listed funds due to the different residual values. Thus, the highest TVPI was achieved by fund X with a multiple of 2.2x, while fund Z has the smallest TVPI due to the lower residual value. At the portfolio level, the above-mentioned ratios result from an aggregation of the cash flows. It is important to note that the cash-on-cash multiples do not take into account the time value of money and are therefore not very meaningful, especially when comparing the performance of different funds.
It is easily seen that the first fund has a significantly higher IRR despite a TVPI that is only 0.2x higher. In the next article, we will explain in more detail why this is the case and how the above-mentioned restriction of the time value can be taken into account by using one of the most respected and at the same time most controversial performance indicators, the IRR.
Dr. Clemens Gregor, Christopher Janik
[1] Cornel, J. (2017). Synthetic Peer Benchmarking for Diversified Private Equity Programs. The Journal of Alternative Investments, 19:4. 53-66.
[2] BVCA (2015). Private Equity Performance Measurement: BVCA Perspectives Series (Working Paper). London, England.
