Market View January
Goldilocks First, Overheating Later — AI, Easing & Fiscal Firepower Extend the Bull
created by Ullrich Fischer, Chief Investment Officer
-
Shock, Resilience, and Resolution: Na...
-
Geopolitics Increase Volatility – Fun...Market View March 2026
-
Markets, Volatility & Productivit...Market View February 2026
-
Dovish Fed Pivot, Labor Softening &am...Market View December 2025
-
The AI Supercycle, Fed Easing & a...Market View November 2025
-
Skepticism Fuels the Bull: Under-Owne...Market View October 2025
-
AI Momentum, Fed Shift, Inflation WatchMarket View September 2025
-
Rally Faces Headwinds: Markets Remain...Market View August 2025
-
The return of Goldilocks is taking shapeMarket View July 2025
-
Resilient stock markets have more roo...Market View June 2025
-
Markets Recover Despite Fragile Senti...Market View May 2025
-
US Tariffs and Their Impact: Risks fo...Market View April 2025
-
Market Upheaval: US Protectionism and...Market View March 2025
-
Markets on the move: Volatility, AI c...Market View February 2025
-
After the Rally: Market Volatility an...Market View January 2025
-
Positive momentum and US exceptionali...Market View December 2024
-
Resilient US growth amid election unc...Market View November 2024
Executive Summary
Our base case for 2026 is a continued global equity bull market, with a constructive, risk-on backdrop—not because valuations are cheap, but because the macro mix is unusually supportive, particularly in the first half of the year. Ongoing disinflation in shelter, energy, and labor in the U.S., combined with re-accelerating growth and an accommodative Federal Reserve, typically creates an environment that rewards risk-taking.
That same setup, however, increases the likelihood of a more challenging second half. A large U.S. fiscal deficit, around 6–7% of GDP, raises overheating risks once disinflationary tailwinds fade, especially if monetary policy remains anchored to backward-looking labor data.
We therefore see “peak Goldilocks” conditions in the first half, followed by a period in which markets may need to reprice around higher yields, fading easing expectations, and renewed inflation concerns.
- We expect the U.S. to outpace other developed markets amid a global expansion in 2026, with U.S. real GDP growth likely to exceed the 2% Bloomberg consensus. If productivity continues to improve—supported by corporate AI adoption—real growth around 3% appears plausible to us.
- Should the U.S. economy continue to improve as we expect, the Fed’s policy stance will appear exceptionally loose by mid-year.
- Such an outcome would support stronger earnings and potentially further margin and valuation expansion in an AI-enhanced “jobless recovery,” where growth remains firm despite subdued hiring and the Fed continues easing.
- In that regime, bubble risks rise, particularly if the AI story remains the dominant growth driver.
- Political uncertainty in 2026 is expected to remain high, shaped by the approaching U.S. midterm elections and, more importantly, by aggressive U.S. foreign policy, intensifying great-power rivalry, and unpredictable escalation risks—particularly between the U.S. and China.
- The key risks to our outlook are monetary policy missteps, geopolitical shocks, and AI disappointment.
An overweight allocation to global equities, gold, and other real assets aligns with our base case. Equities are expected to benefit from supportive growth dynamics and a broad-based earnings recovery, while gold serves as a hedge against currency debasement, policy uncertainty, and potential risks to Federal Reserve credibility should inflation re-emerge. By the same logic, we maintain an underweight allocation to fixed income investments.
Bottom line: Barring an external shock, the key risk in 2026 is overheating rather than weakening growth. Until that risk becomes tangible, disinflation, supportive policy settings, strong fiscal impulses, and broad earnings momentum justify a bullish bias—with the bond market serving as a critical barometer. Investors will need disciplined, data-driven risk management: remaining exposed to upside potential while recognizing that prolonged bear markets have historically followed the peak of major capex cycles similar to the one unfolding today.
As usual, our January market outlook is a longer piece. We believe this is necessary to give you a clear sense of how we see the world and how we are approaching the year ahead. We have tried to structure it carefully to ensure readability. The team is excited to engage with the opportunities and challenges the markets may present.
2025 Lookback: numbers, highlights, and key learnings
- Equities rallied globally: The S&P 500 rose 17.9% on a total-return basis in USD, but lagged international equities. The MSCI Emerging Markets Index advanced 34.3%, marking its first year of outperformance versus developed markets since 2017.
- Earnings were the driver: Of the S&P 500’s 17.9% gain, only 2.1 percentage points (ppt) were driven by multiple expansion, while 14.3 ppt came from earnings growth and 2.1 ppt from dividends, according to Carson.
- In the U.S., growth stocks outpaced value, while in other developed markets, value stocks generally outperformed. At the global level, the MSCI growth and value style indices posted nearly identical returns of +21.3% and 21.6% in USD, respectively.
- The quality factor underperformed (+16.5% in USD for the MSCI World Quality Index).
- Volatility rose: The average VIX was materially higher than in 2024 (18.9 versus 15.6), with the year’s peak occurring during the April “Liberation Day” crash reaching the upper end of the historical range.
- Active management struggled: only 27% of large-cap U.S. equity managers outperformed the S&P 500, the 4th weakest year since 2007 according to Bloomberg.
- Leadership broadened: only two (Alphabet and Nvidia) of the Magnificent 7 outperformed the S&P 500, yet as a group the “Mag 7” (+24.9%) still beat the index.
- The U.S. dollar fell sharply: The Dollar Index (DXY) dropped about ~9%, its worst year since 2017, reversing a +8% gain in 2024.
- Commodities led: industrial and precious metals stood out (gold rose ~64% in USD, its best year since 1979), while energy lagged.
- Bonds rebounded in 2025, yet fixed income still carries the scars of a difficult decade.
- Tariffs added ~50 bps to core U.S. PCE inflation in 2025 according to Goldman Sachs. It seems markets are increasingly treating this as a one-off price-level effect that should roll off in 2026.
- On the policy front: the failure of “DOGE” underlined two realities. First, the U.S. is unlikely to move away from bipartisan deficit spending unless a real funding or fiscal crisis forces a change. Second, the dual pressure of expanding expenditures and tax-cut persistence increases the risk that Federal Reserve independence erodes over time.
2026 Wall Street Consensus: optimistic, not euphoric
The median strategist target for the S&P 500 implies a 9.5% upside from the 2025 close. We would lean above that and see scope for a double-digit advance. If realized, this would mark the first time since 1999 that the S&P 500 has delivered four consecutive years of double-digit returns.
Consensus expects earnings upside to be partly offset by multiple compression, whereas we see scope for multiple expansion. When margins are expanding and the Fed is easing, history tends to favor multiple growth – declining multiples are the exception.
- For 2026, the average S&P 500 earnings-per-share estimate implies roughly 13% earnings growth. What’s unusual is the timing: Q4 2025 estimates are rising into the reporting season, against the typical seasonal pattern of downward revisions. In fact, since 2011, only 2020 saw a faster late-year acceleration than we currently observe.
- Earnings breadth is also notable: 59 of 62 GICS (Global Industry Classification Standards) industries are expected to grow earnings in 2026 — potentially the strongest and most broad-based earnings cycle since 2021.
- Margins reinforce the setup. Analysts see S&P 500 profit margins up ~90 bps in 2026 to ~14.7%, with a move toward ~15.5% by end-2027, in our view, a justified expectation given the prospect of AI efficiency gains.
- Historically, P/E ratios rarely shrink when margins are rising and the Fed is cutting. The main exceptions (2000, 2018, 2022) occurred during tightening cycles.
Our View on 2026: Goldilocks in H1, running too hot in H2
Entering 2026, the macro setup to us is “Goldilocks”: inflation is cooling without a collapse in demand as several disinflationary forces are working at once. Oil is down notably, wage pressure has eased, and shelter inflation—around 35% of measured CPI—is trending lower.
- Owner’s Equivalent Rent has printed its lowest level in five years, and market-based rent indices are still falling, pointing to shelter disinflation as a meaningful drag on headline inflation at least through H1 2026. One caveat: late-2025 CPI shelter inflation was likely understated due to missing October data and methodological smoothing, which may have exaggerated near-term disinflation. Even adjusting for that distortion, the underlying trend remains constructive: shelter, oil, and labor all appear to be in cyclical disinflation for the time being.
Fiscal policy will be a strong tailwind. The U.S. deficit is running near 6–7% of GDP, with the peak stimulative effect of Trump’s “beautiful bill” coming over the next three quarters. No modern U.S. recession has started with a deficit this large. Additional fiscal impulse in 2026—via deregulation, tax changes, and direct-to-consumer “tariff rebates”—is plausible.
- Tariff Supreme Court ruling expected in Q1: Prediction markets largely anticipate that Trump’s IEEPA tariffs will be overturned, though a partial ruling is still possible. Analysts expect the U.S. effective tariff rate to fall significantly (Yale Budget Lab: from 16.8% to 9.3%), but alternative tariff tools are available to the administration. Trump is unlikely to retreat completely, leaving tariff policy uncertainty high, and while a rollback would act as short-term stimulus, it would also intensify concerns over fiscal sustainability.
The “Jobless Recovery” Parallel: The current growth–labor mix is rare. In Q3 2025, real GDP grew 1.1% (non-annualized) while unemployment rose. Since 1980, only 9 of 183 quarters have shown this combination. The closest parallel is Q2 1992—a recovery where productivity surged while employment lagged. Today’s backdrop may rhyme with these past jobless recoveries. Fiscal stimulus, AI capex, and improving productivity—tied to AI diffusion—can allow output to expand without matching labor demand. In that setup, higher unemployment alongside solid growth can reflect efficiency gains rather than fragility.
- Goldman Sachs notes that nonfarm labor productivity has averaged around 2% over the past five years, versus a pre-pandemic trend of roughly 1.5%. Given the still-limited adoption of AI during this period, this raises the question of why productivity growth could not accelerate toward 2.5% over the next five years.
In a bull scenario where productivity gains accelerate unexpectedly fast and forcefully, the traditional link between GDP growth and job creation could weaken markedly—representing a true regime shift with far-reaching implications for wages, corporate margins, and economic policy. This could be a dream outcome for equity markets, though it suggests structural headwinds for the real economy. That said, it is far too early to draw any such conclusions.
A new Fed Chair in 2026
With inflation easing, the Fed has more room to cut rates. Since the second half of 2025 its reaction function appears to prioritize the labor market first, financial stability second, and inflation only third. The path of least resistance is for more rate cuts in H1 toward ~3% in the federal funds rate, we think.
This dovish stance will likely be reinforced by a new Fed Chair, with an announcement expected in the coming weeks. Hassett and Warsh are still leading the betting markets with ~40% odds each.
- That said, the December Employment Report due on January 9 will matter greatly, as it will be the first instance of (nearly) clean data after a long stretch of government-shutdown-induced noise.
Risks will rise if a new Chair is perceived as responding to political pressure rather than sticking to the Fed’s core mandates. If the new Chair is seen as more tolerant of inflation, bond markets will be the first to react. They may judge the new Chair as deliberately “late” in pushing back should inflation re-accelerate.
- The cautionary tales are rare but instructive: the only two “easing-cycle failures” after Fed pauses were 1976 and 1977, when policy was viewed as overly dovish under Arthur Burns.
Putting that aside, historically markets tend to “test” new Fed leadership, according to Ned Davis Research. Across 15 Fed Chairs (going back to the 1910s), the Dow Jones Industrial Average shows an average maximum drawdown of ~15% and a median drawdown of ~10% in the first six months after a new Chair takes office. Jerome Powell saw a drawdown of around 9% in his first six months.
QE is expected to return in the coming years
Zooming further out, the Trump administration is pushing a more pro-growth mix: large fiscal support layered with additional tax cuts, substantial deregulation, and selective reshoring of strategically important industries. These shifts could deliver a multi-year boost to growth that markets may still underappreciate.
Geopolitics is widening a supply–demand gap in the Treasury market, and only the Fed has a balance sheet large and flexible enough to absorb it. Over time, this raises the risk that Fed independence gradually erodes—likely framed as “structural reforms” to support jobs and growth. Faster AI adoption may reinforce this pressure by increasing the odds of a jobless recovery.
Sustained deficit spending points to financial repression and currency debasement. Recent balance-sheet actions suggest the Fed may be shifting toward a more permanently expansionary posture, alongside potential rule and framework changes that keep real policy rates negative and increase reliance on repo markets—eventually extending to more explicit yield-curve control. Treasury financing is also likely to stay tilted toward short-dated bills, in an attempt to limit duration risk and while supporting global liquidity.
2026 as the AI “revelation year” ?
The sustainability of the equity bull market will hinge not only on continued gains from AI leaders, but also on broader AI adoption across industries. As AI becomes embedded in everyday business processes, early adopters should begin to distinguish themselves through practical enterprise applications and increasingly visible productivity gains. We expect adoption to scale with company size and quality, as larger, best-in-class operators typically move first.
- Autonomous driving offers significant medium-term upside via logistics efficiency, labor substitution, safety, and time savings. Another standout opportunity is AI-driven drug discovery by potentially massively increasing clinical trial success rates, viable trials and approved therapies.
Is it a bubble?: While fears of an AI bubble are widespread, today’s market looks fundamentally different from the dot-com era. Valuations so far have expanded largely in line with earnings growth. Importantly, valuations are not a timing tool—they provide fuel, not the spark – and sentiment remains more skeptical than euphoric, leaving meaningful runway for the AI trade.
Here are some awe-inducing facts from JPMorgan’s Michael Cembalest’s latest “Eye on the Markets” report:
- Since November 2022, 42 AI-related companies generated 65%–75% of S&P 500 returns, earnings, and capex/R&D.
- Without these 42 stocks, the S&P 500 would have underperformed Europe, Japan, and China.
- Direct AI stocks represent ~50% of S&P 500 market cap but only ~5% of S&P 500 net debt.
- The hyperscalers (Microsoft, Alphabet, Amazon, Meta) spent USD 1.3 trillion on AI-related capex and R&D since Q4 2022, funded mostly from cash flow, not debt. However, debt financing has begun to increase in 2025.
- Tech capex contributed 40%–45% of U.S. GDP growth over the last three quarters, up from <5% in early 2023.
- Tech PEG (Price/Earnings-to-Growth) ratios (1x–3x) are far below dot-com-era levels (4x–8x).
Ned Davis Research (NDR) estimates that high-tech capex growth exceeded non-tech capex by more than 10% in all four quarters of 2025, describing the current environment as a capex “TINA” (there is no alternative) cycle.
- Historically, the next cyclical bear market has begun around 11 months after such a phase ended—which is not yet apparent.
- Using the dot-com period as a guide, NDR’s qualitative assessment places today’s tech cycle in late-1998 territory.
- When we check this with valuations, they are elevated but not euphoric, with the S&P 500 Technology 12M forward P/E at 26, similar to May 1998 and well below the 50+ multiple seen at the March 2000 peak.
- According to NDR, there is currently only limited evidence of “overbuilding” in the data center sector. At the same time, early signs of speculative construction activity are emerging, similar to those seen in late 1998. Unlike the dot-com era, today’s buildout faces much higher barriers: bringing hyperscale datacenters online is significantly more complex, with power availability and grid constraints acting as key bottlenecks that slow the pace of expansion.
2026 Outlook ex-U.S.
A broad group of advanced economies—Japan, Germany, Australia, Canada, Sweden, Poland, and Korea—are moving toward material primary fiscal expansion. The scale is especially large in Japan and Germany, at roughly 1.5–2.0% of GDP. At the same time, commodity-exporting emerging markets are seeing a notable boost from improved terms of trade.
Europe: Europe enters 2026 with an improving outlook, although momentum continues to trail that of the U.S. Consensus expects real GDP growth of around 1–1.5%, which we believe is likely to come in toward the upper end of that range. Capital expenditure should pick up, supported by greater fiscal flexibility and re-industrialization efforts as Europe seeks increased strategic autonomy. Political uncertainty remains an important risk—particularly around fiscal discipline in countries such as France—though difficult policy decisions and fiscal consolidation have largely been postponed until the 2027 presidential election there. Europe is generally less exposed to AI-related excesses, but also less leveraged to the upside from AI investment. Valuations, however, remain attractive in relative terms.
Switzerland: Switzerland exhibits the traits of a quality-defensive market with hard-currency profile. A broader earnings recovery and a shift in the AI narrative from infrastructure to adoption should be supportive for Swiss equities.
China: According to JPM, China now leads globally in clean-energy patents, AI patents, and nuclear engineering research, supported by a sharp rise in power generation since 2019 (+2,500 TWh equivalent to 5-6 times the annual electricity consumption of Germany, compared with +221 TWh in the U.S. and −110 TWh in Europe). This reflects an aggressive industrial policy, estimated at around 2% of GDP, with subsidies accounting for 20–40% of profits in some strategic sectors.
- Sanctions have accelerated China’s push toward technological self-sufficiency. Huawei’s Ascend 910C now represents over 75% of domestic AI chip output, while China is also developing indigenous EUV lithography (think of ASML), with prototype systems targeted for 2028–2030.
- Although Huawei continues to lag NVIDIA at the individual chip level, it increasingly competes at the cluster level by leveraging scale and state support.
- Chinese AI LLM adoption is also surging globally, driven by high-performance, cost-effective, open-source models from DeepSeek, Alibaba (Qwen), and Moonshot (Kimi), with late-2025 usage near 30% of global activity.
- Overall, China remains one-to-three technology generations behind—most notably in cutting-edge GPUs and advanced nodes (<7nm), power efficiency (watts per teraflop), and high-bandwidth memory, interconnects, and software ecosystems—but is narrowing the gap faster than commonly assumed. The U.S., however, continues to hold a decisive advantage in AI training budgets.
Japan: Japan’s structural turnaround remains one of the most compelling stories among developed markets. With deflation firmly in the past, the economic agenda of new Prime Minister Sanae Takaichi—referred to as “Sanaenomics”—together with ongoing corporate governance reforms, continues to underpin earnings growth and more shareholder-friendly capital allocation.
Our positioning for 2026
Global equities are entering the fourth year of a cyclical bull market. Historically, such cycles tend to end either with a recession or with sustained monetary tightening—neither of which appears imminent. Inflation for now remains well contained, nominal U.S. growth is expected to run comfortably above 5%, and policy rates near 3%—a macro constellation last seen in 1998 and 2003.
A central pillar of our outlook is the expectation that AI-driven productivity gains reach escape velocity in 2026. As adoption broadens, these gains should help offset labor-market cooling, support corporate margins, and extend the expansion while keeping inflation at bay. In our view, consensus continues to underestimate the combined and positive reinforcing impact of these dynamics.
Technical conditions also point to a constructive near-term setup. Historically, in the 18 months following equity drawdowns exceeding 18% — such as the Liberation Day episode — the S&P 500 has delivered average returns of roughly 47%, compared with about 14% in a typical 18-month period. Notably, these recoveries have also featured materially shallower drawdowns (around 12% versus 20%), according to 3Fourteen Research.
Against this backdrop, we advocate a risk-on portfolio stance, with an overweight to equities and gold. Portfolio diversification should be enhanced through alternative strategies, while a modest allocation to Bitcoin and Ethereum may provide additional upside in a “fiat debasement world”.
Within developed markets, large-cap, high-quality companies are best positioned to lead the implementation of AI. At the same time, emerging market equities stand out as one of the most attractive complements we have seen in many years.
Finally, we recommend a disciplined currency approach, maintaining at least 60% of exposure in the investor’s reference currency to limit volatility and safeguard returns.
Key indicators to watch for potential downside:
- A sustained rise in jobless claims signaling cyclical stress
- A renewed shift toward monetary tightening
- Indiscriminate enthusiasm for AI assets without earnings discipline
- We are closely monitoring GPU rental prices for evidence of softening demand.
- We also monitor retail investors’ behavior, as their activity is no longer marginal to market outcomes; they are now a primary driver
Quick thoughts on key themes this year…
Quality: While 2025 proved surprisingly challenging for the quality factor, the outlook for 2026 is more constructive. We expect accelerating AI adoption among large, high-quality companies to shift factor leadership back toward quality, with an emphasis on implementation beneficiaries rather than just headline AI winners. On a regional basis, the U.S. stands out as higher in quality than Europe, Japan, and China, with superior ROA and ROE metrics, justifying a valuation premium. The same logic applies to the Swiss market.
U.S. midterms: Midterm years are often labeled the “worst” part of the presidential cycle. Since 1950, average S&P 500 returns were 4.6% with average drawdowns of 17.5%. But the real drivers are recession risk and Fed tightening. In midterm years with no recession and no Fed hikes, average returns rise to 10.6% (5 of 18 midterms met those conditions, and all five delivered double-digit gains), according to 3Fourteen Research. Midterms tend to increase volatility and uncertainty, but they aren’t inherently bearish unless the macro environment worsens—and political uncertainty has become the new normal anyway.
USD: Our bias remains lower. U.S. growth is outperforming other developed markets, but the Fed is easing into that strength pushing real rates down relative to peers. With the USD still structurally overvalued and many non-U.S. central banks likely finished easing, risks tilt toward a weaker dollar.
EM Equities: We expect EM outperformance to continue in 2026, supported by prudent macro policies that favor low inflation, sustainable debt rather than aggressive growth and a weaker USD. EM markets offer AI exposure at significantly cheaper valuations—around a 40% discount to U.S. tech—alongside several uncorrelated growth engines.
Gold and commodities: We have been bullish on gold since 2016, viewing it as a strategic diversifier amid fiscal deficits, currency debasement, and rising risks to central-bank credibility. Emerging-market central banks continue to diversify reserves. Last year gold surpassed U.S. Treasuries as the largest global Reserve asset. We see gold reaching USD 5,000 per ounce in 2026. More broadly, U.S.–China rivalry and supply-chain concentration are restoring commodities as portfolio insurance, with industrial metals likely to follow precious metals.
Bonds: Bonds remain unappealing. We expect U.S. yields to ease in Q1 as unemployment rises, but to move higher again into the second half of the year. Long-dated Treasuries may need to reflect a higher risk premium, particularly if inflation reaccelerates under a persistently dovish Fed. As a rule of thumb, we think equity markets begin to struggle when the U.S. 10-year yield moves above 4.5% but the pace of the move is crucial. We also anticipate further yield-curve steepening.
Credit: Credit spreads are close to pre-GFC lows, offering little compensation for default and liquidity risk—leaving limited upside and asymmetric downside if growth slows or a shock hits. At the same time, a corporate maturity wall linked to heavy 2020 issuance is coming due this year, as high-yield bonds and leveraged loans typically carry maturities of five years or longer.
Geopolitics:
- Several analysts argue that the U.S. military operation in Venezuela marked the emergence of the so-called “Donroe Doctrine,” echoing a 19th-century framework that asserts U.S. primacy in the Western Hemisphere. The Trump administration has articulated a unilateral right to prevent rival powers from owning or controlling strategically vital assets in the region, with particular emphasis on curbing Chinese influence.
- While Venezuela holds vast oil reserves, a return to low-cost supply appears unlikely in the near term. Much of its crude is heavy and sour, implying higher extraction and processing costs.
- USMCA renegotiation is approaching. Canada’s leverage via heavy crude exports may now be diluted.
- Global reliance on Taiwan for advanced chips exceeds Europe’s former reliance on Russian energy. Eight of the ten largest global companies depend heavily on TSMC. By 2028, the U.S. may reach only ~30% to 35% self-sufficiency in advanced nodes. Any Taiwan disruption would cause a global economic shock far exceeding recent geopolitical supply crises, according to JPMorgan’s Cembalest.
- Many observers anticipate that a renewed bid for Greenland will be a priority on Trump’s upcoming agenda.
- A successful transition to a more liberal regime in Iran, coupled with the removal of sanctions, could prove to be a significant positive catalyst for European energy costs.
S&P 500 12 months forward Price-Earnings multiple
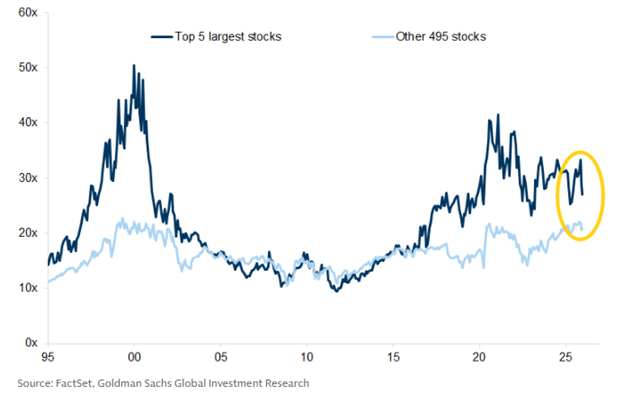
Valuations among mega-cap stocks do not suggest bubble dynamics. The five largest firms command meaningfully lower multiples than at the peak of the last tech cycle, even as balance sheets and profitability have improved. The broader market trades at lower multiples as well, albeit at levels last seen around the 2000 peak.
Sources: Bloomberg, Morgan Stanley, Bank of America, Goldman Sachs, The Macro Compass, The Market Ear, Steno Research, 42Macro, JPMorgan, Hightower Naples, Strategas, Financial Times, LBBW, BCA Research, 3Fourteen Research, Carson
-
Shock, Resilience, and Resolution: Na...
-
Geopolitics Increase Volatility – Fun...Market View March
-
Markets, Volatility & Productivit...Market View February
-
Dovish Fed Pivot, Labor Softening &am...Market View December
-
The AI Supercycle, Fed Easing & a...Market View November
-
Skepticism Fuels the Bull: Under-Owne...Market View October
-
AI Momentum, Fed Shift, Inflation WatchMarket View September
-
Rally Faces Headwinds: Markets Remain...Market View August
-
The return of Goldilocks is taking shapeMarket View July
-
Resilient stock markets have more roo...Market View June
-
Markets Recover Despite Fragile Senti...Market View May
-
US Tariffs and Their Impact: Risks fo...Market View April
-
Market Upheaval: US Protectionism and...Market View March
-
Markets on the move: Volatility, AI c...Market View February
-
After the Rally: Market Volatility an...Market View January
-
Positive momentum and US exceptionali...Market View December
-
Resilient US growth amid election unc...Market View November
Disclaimer
This Publication was created on 08.01.2026.
The information contained in this document constitutes a marketing communication from FINAD (FINAD AG, Zurich; FINAD GmbH, Vienna or FINAD GmbH, Hamburg branch). This marketing communication has not been prepared in accordance with legislation promoting the independence of investment research and is not subject to any prohibition on trading following the dissemination of investment research. This document is for general information purposes only and for the personal use of the recipient of this document (hereafter referred to as “recipient”). It does not constitute a binding offer or invitation by or on behalf of FINAD to purchase, subscribe, sell or return any investment or to invest in any particular trading strategy or to engage in any other transaction in any jurisdiction. It does not constitute a recommendation by FINAD in legal, accounting or tax matters or a representation by FINAD as to the suitability or appropriateness of any particular investment strategy, transaction or investment for any individual recipient. A reference to past performance should not be construed as an indication of the future. The information and analyses contained in this publication have been compiled from sources believed to be reliable and credible. However, FINAD makes no warranty as to their reliability or completeness and disclaims any liability for losses arising from the use of this information. All opinions and views represent estimations that were valid at the time of going to press; we reserve the right to make changes at any time without obligation to update or communicate them. Before making any investment, transaction or other financial decision, recipients should clarify the suitability of such investment, transaction or other business for their particular circumstances and independently (with their professional advisors if necessary) consider the specific risks and the legal, regulatory, credit, tax and accounting consequences. It is the responsibility of the respective recipient to verify that he/she is entitled under the law applicable in his/her country of residence and/or nationality to request, receive and use this publication for personal purposes. FINAD declines any liability in this respect. An investment in the funds and other financial instruments mentioned in this document should only be made after careful reading and examination of the latest sales prospectus, the fund regulations and the legal information contained therein and after prior consultation with your client advisor and – if necessary – your own legal and/or tax advisor. It is the responsibility of the respective recipient to check whether he is entitled to request and receive the relevant fund documents under the law applicable in his country of residence and/or nationality. Neither this document nor copies thereof may be sent to or taken into the United States or distributed in the United States or handed over to US persons.
This document may not be reproduced in part or in full without the prior written consent of FINAD.
For Switzerland: FINAD AG, Talstrasse 58, 8001 Zurich, Switzerland is a public limited company specialized in financial services and asset management, established under Swiss law. FINAD is authorised as asset manager by the Swiss Financial Market Supervisory Authority (FINMA) and supervised by the Supervisory Organization (SO) AOOS. FINAD is also associated with OFS Ombud Finance Switzerland (http://www.ombudfinance.ch). Complaints about FINAD can be addressed to SO AOOS or OFS.
For Austria: FINAD GmbH, Dorotheergasse 6-8/L021, 1010 Vienna, Austria is an investment firm according to Section 3 of the Austrian Securities Supervision Act 2018 (WAG 2018) and as such is entitled to provide investment services of investment advice, portfolio management as well as the acceptance and transmission of orders, in each case with regard to financial instruments. FINAD is not authorized to provide services that involve holding clients’ money, securities or other instruments. FINAD is subject to the supervision of the Financial Market Authority (FMA), Otto-Wagner-Platz 5, 1090 Vienna (www.fma.gv.at). Complaints about FINAD may be submitted to the FMA.
For Germany: FINAD GmbH Deutschland, Schauenburgerstraße 61, 20095 Hamburg, Germany is the German branch of FINAD GmbH, Dorotheergasse 6-8/L/021, AT-1010 Vienna, Austria. FINAD is an independent securities services company specialized in investment advice, investment brokerage and asset management (financial portfolio management). The provision of securities services by FINAD is subject to the supervision of the Financial Market Authority (FMA), Otto-Wagner-Platz 5, 1090 Vienna, Austria (www.fma.gv.at) as well as the Federal Financial Supervisory Authority (BaFin), Graurheindorfer Straße 108, 53117 Bonn, Germany and Marie-Curie-Straße 24-28, 60439 Frankfurt am Main, Germany (www.bafin.de). Complaints about FINAD can be addressed to the FMA or BaFin.
FINAD is not authorized to practice law, provide tax advice or auditing services.
© Copyright FINAD – all rights reserved.
For more details about the company, please visit https://finad.com/en/imprint.